

The recession debate has died down a bit as political and financial commentators gravitated to the next dumb debate over the White House’s quote of zero inflation for July. Inflation was zero for July. The inflation rate for the twelve months ending in July is 8.5%. I am unsure if it was worse seeing so many successful financial professionals had no idea how CPI works or that they were too lazy to open the report before they commented on it.
However, it is crucial to go back to the recession or no recession debate. The two-quarters of the declining GDP definition comes from the econ-101 textbook. It is an easy data point to grab, and we may use it to compare countries worldwide. However, large and developed economies have many complexities and data points to measure them. The United States is the world’s largest economy and has many economic researchers that produce many data points beyond GDP.
The entity that uses economic data and reports on the US business cycles is the apolitical and non-profit National Bureau of Economic Research. It uses a more holistic definition to diagnose where the US is in the economic cycle. Various agencies supply the data compiled by the St. Louis Federal Reserve, which is publicly available via FRED. The NBER uses the FRED data to determine business cycle dates:
- Real personal income less transfers (PILT)
- Nonfarm payroll employment
- Real personal consumption expenditures
- Employment as measured by the household survey
- Real manufacturing and trades sales
- Industrial production
- Real gross domestic product
- Real gross domestic income
Real Personal Income Less Transfers
According to the US Bureau of Economic Research, real personal income is a person’s income for labor or capital and the net transfers from business and government. Adjustments to personal incomes for transfer payments such as unemployment benefits, Social Security, Medicare, and COVID stimulus money reduces the total. After that, the BEA accounts for inflation using the Personal Consumption and Expenditure Price Index.
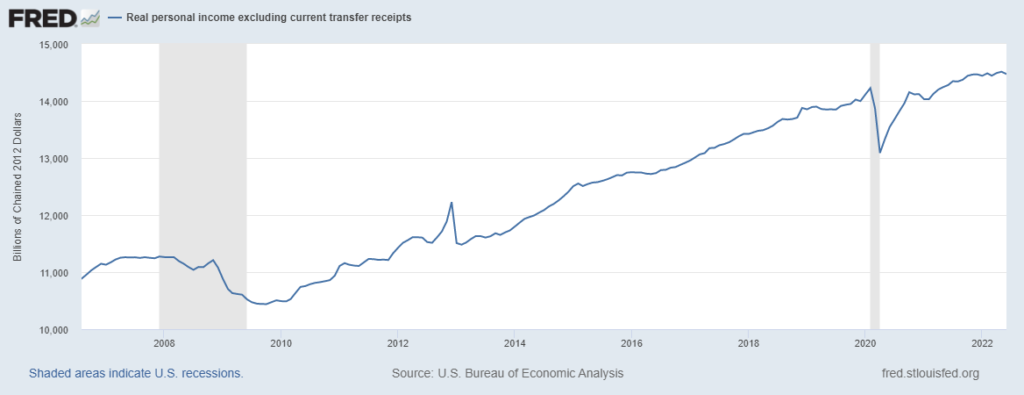
Inflation is lingering longer than anyone thought and is proving more difficult to combat for policymakers. People are struggling the most with real income right now. The latest month-over-month real personal income less transfers number was down 0.28% for July and up 1.4% year over year. Falling real personal incomes indicates that the economy is not doing well and might be in a recession.
Nonfarm Payroll Employment
The nonfarm payroll data point captures the health of overall employment. “It measures the number of US workers in the economy, excluding proprietors, private household employees, unpaid volunteers, farm employees, and the unincorporated self-employed.” The report excludes farmers because of self-employment, unpaid family members, part-time or hobby farmers, other partnerships, and workers who often go undocumented.
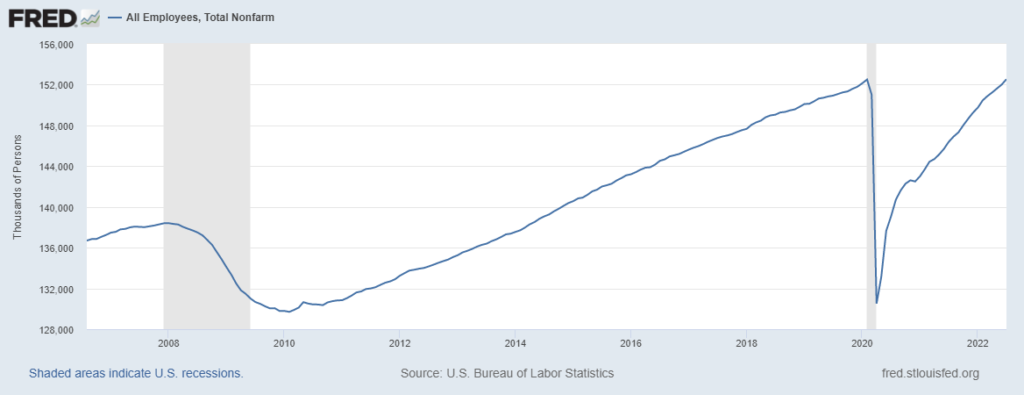
For July, the US saw an increase of 528k in the number of jobs, far surpassing the consensus guess of 250k, dropping the unemployment rate to 3.5%. The labor market’s resiliency is easily the most robust indicator we are not in a recession. The US economy keeps adding jobs despite uncertainty about increasing energy and food costs, the Fed hikes, and tech layoffs. A recession that adds jobs would be pretty odd, but things are bizarre now.
Real Personal Consumption Expenditures
Consumer spending is an enormous part of the economy and plays a considerable role in computing gross domestic product. Spending data gives businesses and policymakers an idea of how well the economy is doing and how to proceed with investment and decisions.
The Beaeura of Economic Analysis uses a theoretical basket of goods and tracks the price changes of that basket to estimate the level of inflation in the economy. The difference in the price of a basket is what economists use to adjust “nominal” to “real” inflation-adjusted purchases.
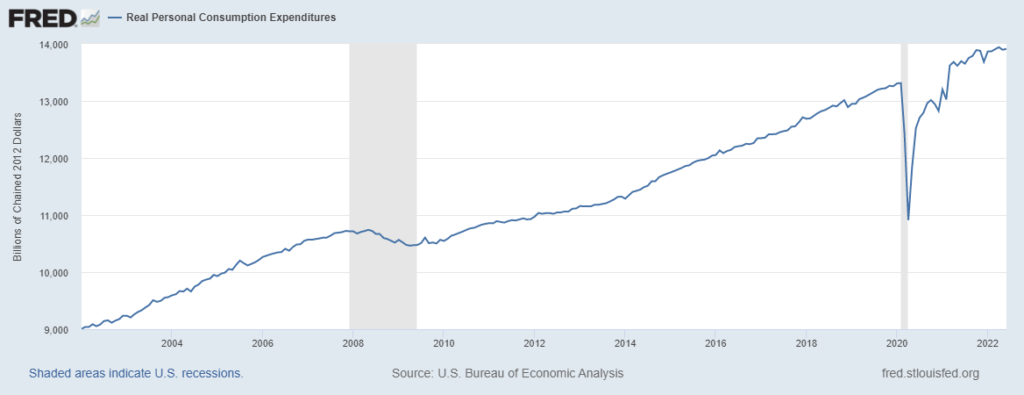
Real personal consumption and expenditures can be pretty volatile but generally trends upwards as the economy grows. The most recent PCE number for June showed an increase of 0.1 percent, meaning consumers keep spending after accounting for inflation. As consumption is the most significant part of the economy, a resilient consumer would indicate that the US is not in a recession.
Real Manufacturing and Trade Sales
The manufacturing and trades sales category is a measure of industrial manufacturing. It is the best measure of how much tangible stuff a business makes, including consumer goods, equipment, materials, and construction. Again, everything is in inflation-adjusted or “real” terms.
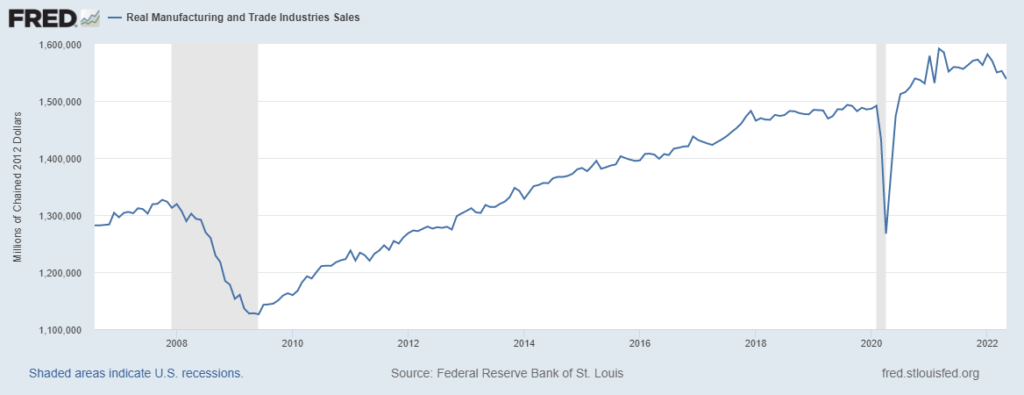
For July, industrial production marched forward 0.6% month-over-month, higher than consensus estimates and up 3.9%year-over-year. Producers continue to struggle with supply chain issues. However, increasing production and output indicate that the US is not in a recession.
Gross Domestic Product and Gross Domestic Income
Gross domestic product measures the total monetary value of finished goods and services produced within a country. It is everything that people make within a country’s borders. It is the primary metric of economic health.
Similarly, gross domestic income is a measure of all the total money earned for goods and services produced within a country. It is the summation of wages, profits, and taxes.
GDI is the money paid to produce GDP. In theory, gross domestic product and gross domestic income should be the same. In practice, the numbers vary slightly as data gathering methods differ, creating statistical discrepancies and sampling errors. GDP data is preferable as its reporting is timelier and more expansive.
Using the Real GDP numbers and the “two-quarter” definition, it looks like the economy is experiencing a recession. There is no disputing that the economy cannot keep pace with inflation.
However, some economists argue that GDI is a better figure to use for economic health. The advanced estimates for GDI are closer to the final reported numbers of GDI and GDP. During previous recessions, early estimates of GDI did a better job of picking up economic declines than GDP alone.
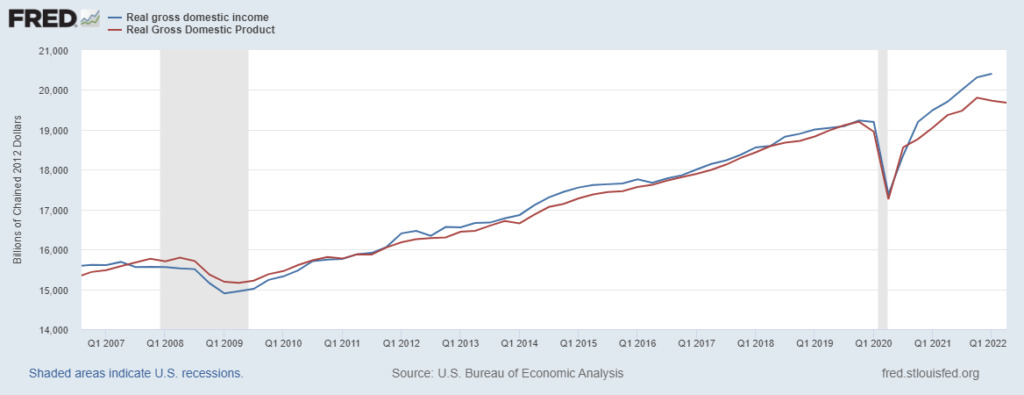
However, US economists have the variety of methods above to diagnose expansions and contractions of the business cycle. We can see a divergence in the trendlines of GDP and GDI. Before 2020, the discrepancy was about 1%. However, the difference widened to 3.5% in the first quarter of this year.
Why Not Both?
A straightforward suggestion for dealing with the growing statistical discrepancy between the two numbers is to average them together into “gross domestic output.” It intuitively makes sense as the numbers are attempting to measure the same thing of economic output. The NBER already uses an average of the two when “dating” the turning point in a cycle.
Combining the numbers into an average reduces measurement errors. Researchers also found that the GDO is a decent predictor of later data revisions. When GDO is higher than the preliminary GDP figure, GDP will likely be revised upward. So, good news for those hoping we are not in a recession.